Markets do not communicate in silence, and their message is only as clear as the medium through which it is received. A trader working from a cluttered, disorganized workspace is not simply dealing with an aesthetic inconvenience. The cognitive load produced by visual friction from irrelevant information, uneven scaling, and overlapping indicators degrades the quality of interpretation before any analytical processing has even begun. That influence is easy to dismiss until the workspace is cleaned up and the difference in perceptual clarity becomes impossible to ignore.
Understanding what the market is actually doing requires separating price behavior from the narrative constructed around it. Financial commentary tends to attribute cause and effect with a confidence the underlying data rarely supports. Prices rose because of this report, fell because of that statement, and held steady because participants were cautious ahead of the next scheduled event. Those explanations are satisfying but often arrive after the fact, retrofitted onto moves the chart had been signaling well before any catalyst was identified. A trader who has learned to read price without the interpretive filter of external commentary operates with a clearer and more accurate view of market reality.
Read More : Share Market Holiday Calendar Explained for Better Trade Planning
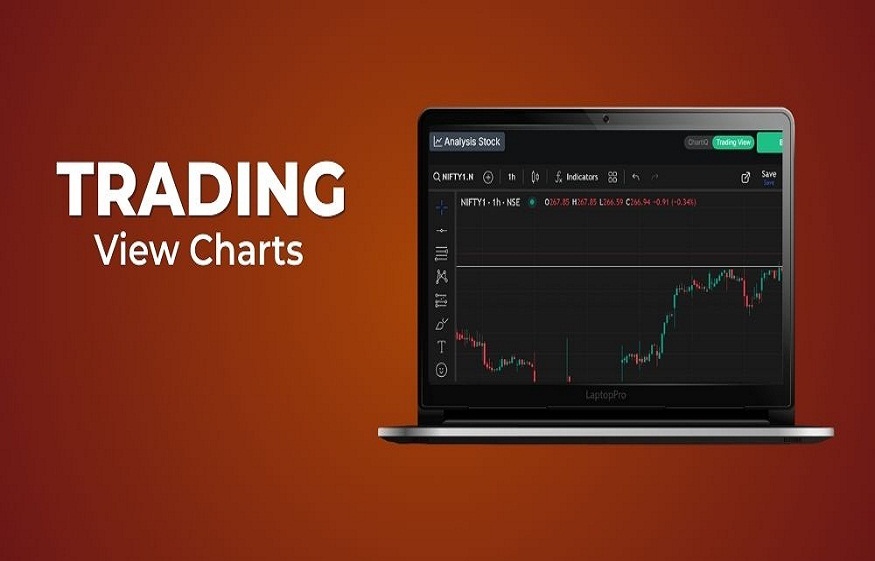
TradingView charts display price action in a manner that encourages direct observation. The candlestick data can be visualized over time in any customizable period, making a trader move easily between the small and the big picture, between the five-minute detail of a chart, and the weekly picture of a chart, without losing the context of what price tells you. That fluid movement between scales is not merely convenient but analytically necessary, because short-term price detail only becomes meaningful when framed within longer-term structure.
Liquidity is one of the least visible yet most significant forces shaping price behavior, and the ability to identify where it accumulates develops only through the kind of sustained visual focus that daily chart work provides. Zones where stop orders are likely clustered, where breakout traders entered on a prior move, and where position holders at key structural levels are defending or exiting can all be read from the chart without proprietary data or institutional access. One trader who spent several months studying liquidity zones in a single index described the first time they identified a stop hunt in real time as the moment a perceptual threshold was crossed, and that the same behavior became recognizable across multiple instruments from that point forward.
One of the most underappreciated qualities of a price chart is its honesty. Price carries no agenda, unlike analyst reports, earnings calls, or central bank communications. It represents the unfiltered aggregate of all participant action, not editorialized, not shaped, and not selectively framed the way most financial communications are. A trader who comes to trust that honesty and builds their analytical framework around actual price observation rather than interpreted narrative establishes a relationship with the market that is considerably sounder than any relationship built on commentary from sources whose motivations and time horizons rarely align with their own.
Read More : Work Anniversary Cards: Small Words, Big Moments at Work
Understanding what the market is doing is ultimately a perceptual discipline. The chart contains information that anyone willing to engage with it seriously can access. What separates traders is the quality of attention brought to that interaction, the patience to observe without forcing conclusions, the experience to recognize meaningful behavior when it appears, and the honesty to acknowledge when the chart is not saying anything definitive, all of which the workspace built around TradingView charts is designed to support, making genuine perception easier and the temptation to mistake visual busyness for analytical insight harder to indulge.
About the Author